Seize Today's Yields or Bet on Wider Credit Spreads Tomorrow?
Yield potential has doubled over the last few years across many sectors of the credit market, especially leveraged loans and high yield bonds. Investors might be on watch, expecting spreads to widen amid slower economic growth and a long-anticipated recession. That said, we believe the yield profile offered in today’s leveraged credit market more than compensates investors for the increased risk associated with tighter spreads. Uncertain economic conditions are transient, and in our experience, accurately timing economic cycles or policy changes can prove extremely elusive.
Today’s Yields Offer a Compelling Opportunity1
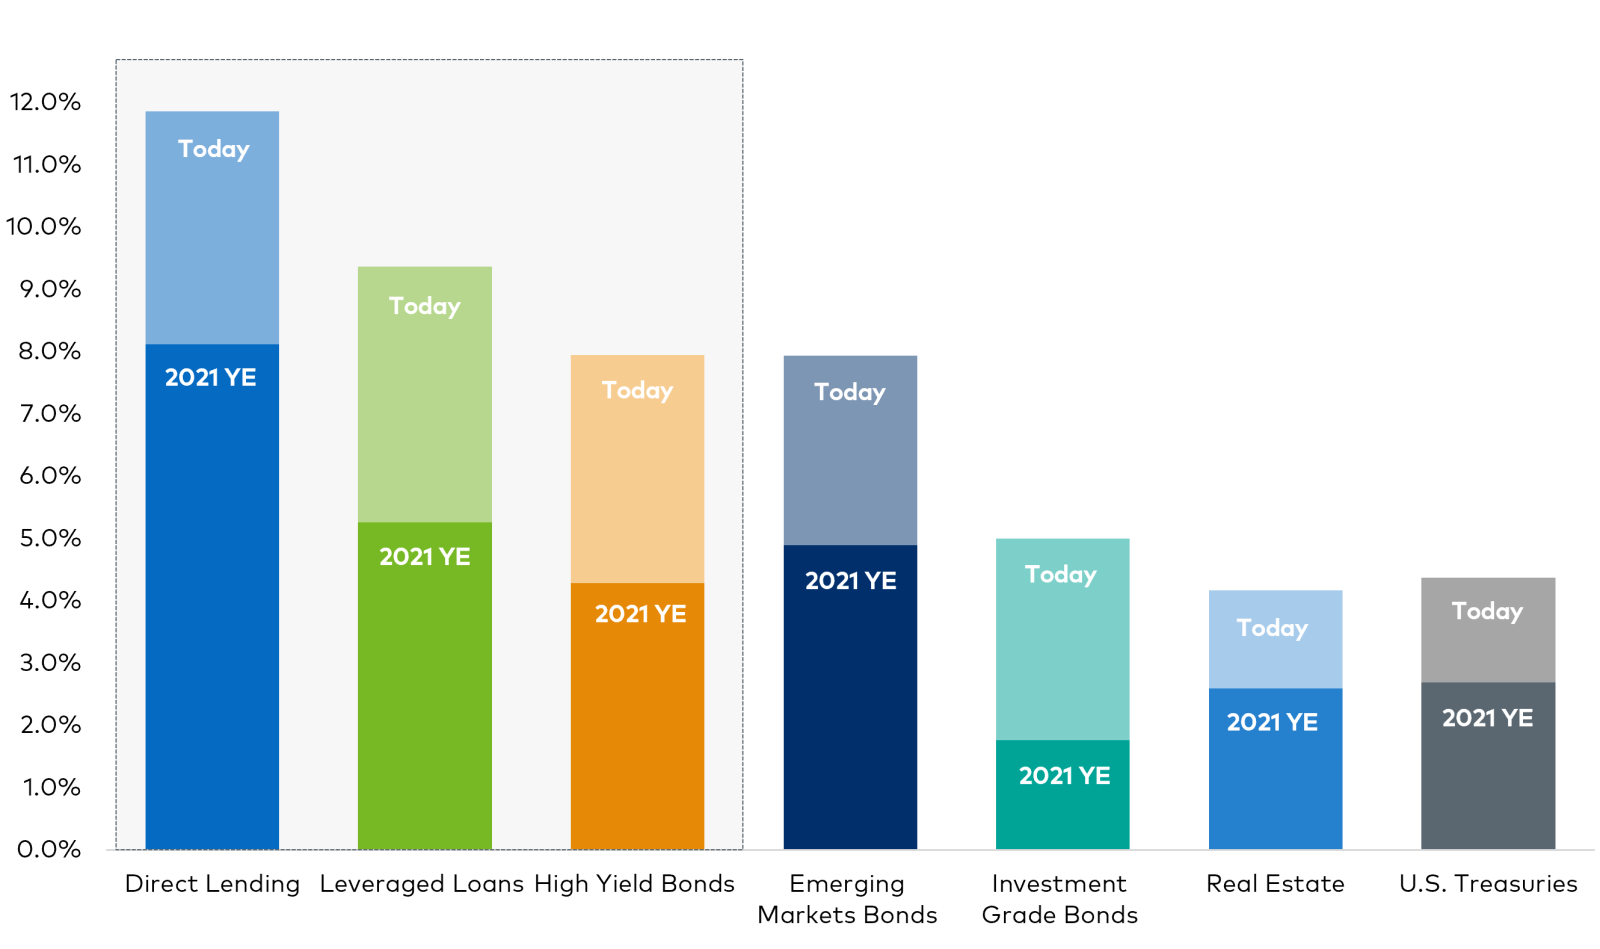
Data as of June 30, 2024.
As we highlighted in our Leveraged Credit 2024 Midyear Review & Outlook, current high yield credit spreads, a forward-looking measure, indicate little to no risk of a recession. However, the truth is that no one can truly know what the future holds. What we do know is that investors are getting paid to own and participate in the leverage credit market right now, and we think today's prices provide a reasonable cushion against incremental spread widening, should it occur. Further, fundamentals support our constructive view on high yield bond and leveraged loan markets.
Attractive Prices May Cushion Against Spread Widening2
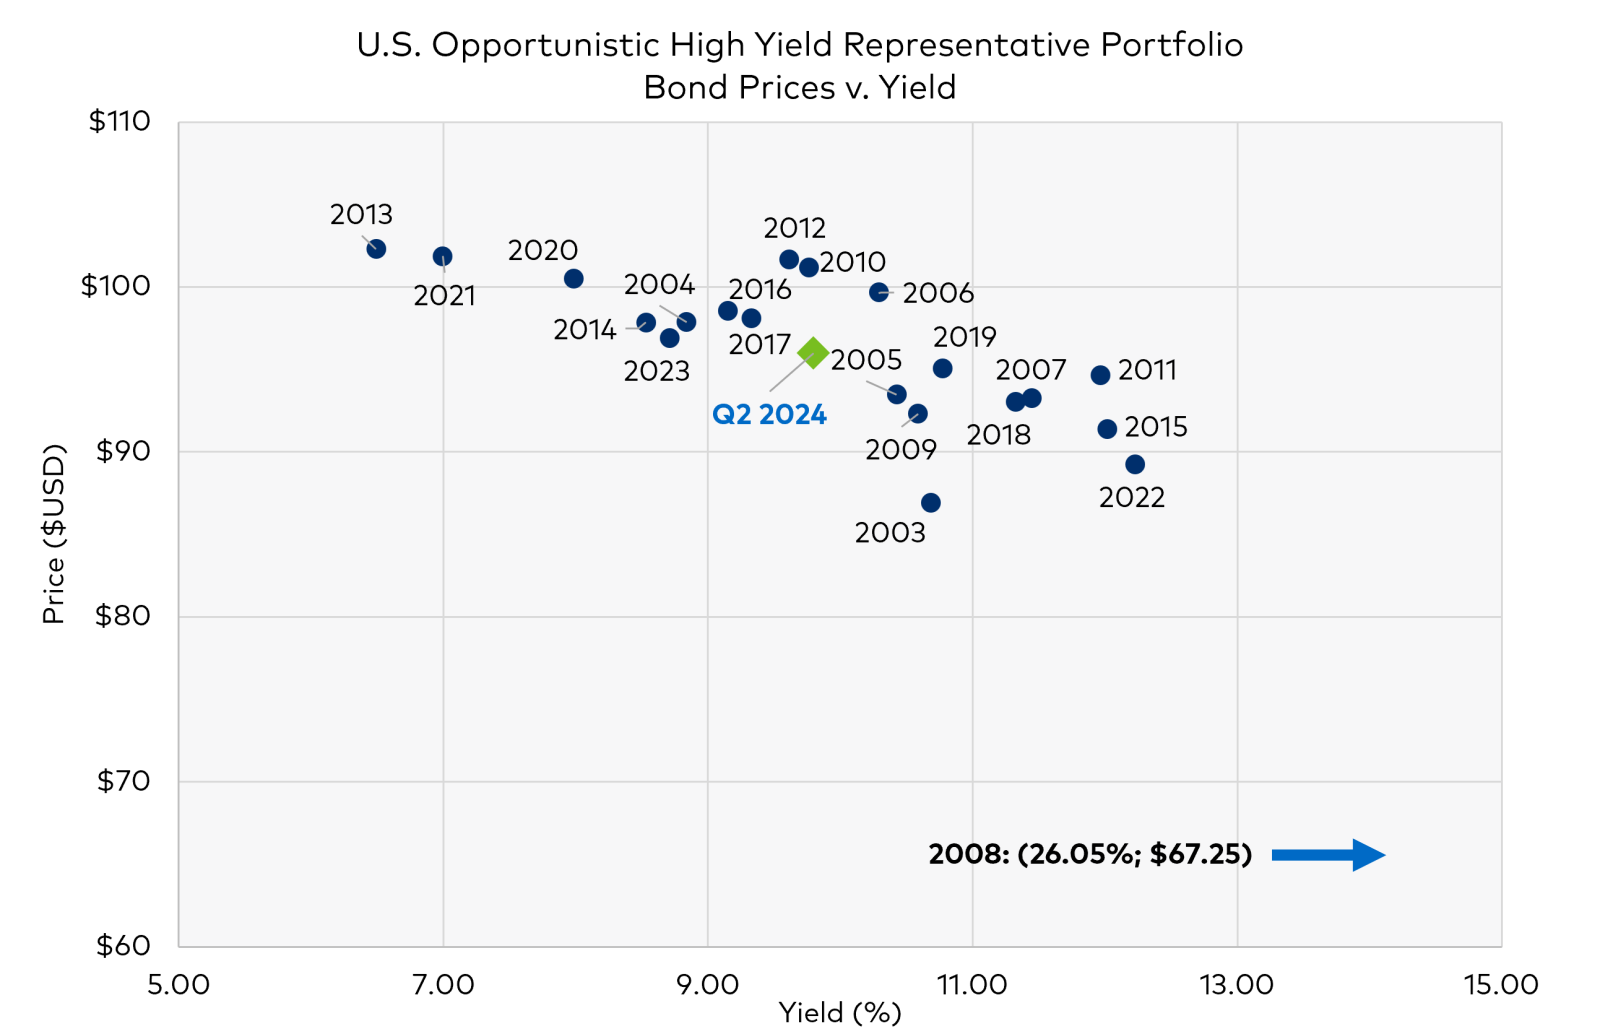
Data as of June 30, 2024.
Seeking Prudent, Long-Term Investments that Offer a Higher Coupon
Our bottom-up, fundamental research process is designed to capture incremental yield without incurring undue risk. We do not chase yield by investing in distressed debt that needs a rosy economic outlook to recover. Rather, we invest for the long term in the debt of good businesses that offer higher coupons relative to the market. Today, much of that debt is on sale at discounted prices at what we believe to be compelling yields. Now may be an opportune time for investors to enhance their portfolio's income-generating potential.
Important Disclosures
1Direct Lending is represented by the Cliffwater Direct Lending Index. High Yield is represented by the ICE BofA U.S. High Yield Index. Leveraged loans are represented by the Credit Suisse Leveraged Loan Index. Emerging Markets is represented by the JP Morgan EMBI Global Index. Real estate is represented by the FTSE/NAREIT Equity REIT Index dividend yield. Investment Grade Bonds (IG Bonds) are represented by the Bloomberg U.S. Aggregate Bond Index. Source for Bloomberg Index: Bloomberg Index Services Limited. Please see the Disclosure page for additional details about the source of the data. U.S. Treasurys are represented by the ICE BofA 10-Year U.S. Treasury Index. Past performance is not indicative of future results.
2Source: Polen Capital. Data as of 06-30-2024. The chart refers to the bond prices in the secondary market for the U.S. Opportunistic High Yield strategy’s representative account. The representative account is an account within the Polen Credit U.S. Opportunistic High Yield Composite that Polen has deemed the most representative of the accounts managed by Polen pursuing the Composite investment strategy. Contractual investment guidelines and length of track record are the most important factors in determining a representative account for the Composite strategy.
Past performance does not guarantee future results and profitable results cannot be guaranteed.
The information provided in this document should not be construed as a recommendation to purchase or sell any particular security. There is no assurance that any securities discussed herein will remain in the composite or that the securities sold will not be repurchased. The securities discussed do not represent the composites’ entire portfolio. Actual holdings will vary depending on the size of the account, cash flows, and restrictions. It should not be assumed that any of the securities transactions or holdings discussed will prove to be profitable, or that the investment recommendations or decisions we make in the future will be profitable or will equal the investment performance of the securities discussed herein.
There can be no guarantee that the portfolio will exhibit identical or similar characteristics to those shown at any future time of investment. Investments are subject to risks, including the possibility that the value of any investment (and income derived thereof (if any)) can increase, decrease or in some cases, be entirely lost and investors may not get back the amount originally invested. This document does not identify all the risks (direct or indirect) or other considerations which might be material to you when entering any financial transaction. The views and strategi es described may not be suitable for all clients.
The ICE BofA U.S. High Yield Index consists primarily of bonds and notes rated BB or lower. However, the benchmark is an unmanaged index and does not include any private (non-144A) obligations, convertible bonds, preferred and common equity, and certain other securities and obligations
The Credit Suisse Leveraged Loan Index is designed to mirror the investable universe of USD institutional leveraged loans, including US and international borrowers.
The Cliffwater Direct Lending Index (“CDLI”) seeks to measure the unlevered, gross of fees performance of U.S. middle market corporate loans, as represented by the underlying assets of Business Development Companies (“BDCs”), including both exchange-traded and unlisted BDCs, subject to certain Eligibility Criteria. The CDLI is an asset-weighted index that is calculated on a quarterly basis using financial statements and other information contained in the U.S. Securities and Exchange Commission (“SEC”) filings of all eligible BDCs.
The J.P. Morgan ESG EMBI Global Diversified Index (JESG EMBIG) tracks liquid, US Dollar emerging market fixed and floating-rate debt instruments issued by sovereign and quasi-sovereign entities.
The FTSE Nareit All Equity REITs Index is a free-float adjusted, market capitalization-weighted index of U.S. equity REITs. Constituents of the index include all tax-qualified REITs with more than 50 percent of total assets in qualifying real estate assets other than mortgages secured by real property.
ICE BofA U.S. 10-15 Year Treasury Index – This index tracks the performance of U.S. dollar-denominated, 10- to 15-year sovereign debt publicly issued by the U.S. government in its domestic market.
The Bloomberg U.S. Aggregate Bond Index, or the Agg, is a broad base, market capitalization-weighted bond market index representing intermediate term investment grade bonds traded in the United States.
Source: Bloomberg Index Services Limited. BLOOMBERG® and the indices referenced herein (the "Indices", and each such index, an "Index") are service marks of Bloomberg Finance L.P. and its affiliates (collectively "Bloomberg”) and/or one or more third-party providers (each such provider, a "Third-Party Provider,”) and have been licensed for use for certain purposes to Polen Capital Credit, LLC (the "Licensee"). To the extent a Third-Party Provider contributes intellectual property in connection with the Index, such third-party products, company names and logos are trademarks or service marks, and remain the property, of such Third-Party Provider. Bloomberg or Bloomberg's licensors own all proprietary rights in the Bloomberg Indices. Neither Bloomberg nor Bloomberg's licensors, including a Third-Party Provider, approves or endorses this material, or guarantees the accuracy or completeness of any information herein, or makes any warranty, express or implied, as to the results to be obtained therefrom and, to the maximum extent allowed by law, neither Bloomberg nor Bloomberg's licensors, including a Third-Party Provider, shall have any liability or responsibility for injury or damages arising in connection therewith.