The Heightened Risk of Passive in U.S. Large-Cap Growth

The Russell 1000 Growth Index has reached the highest concentration levels in its 40-year history. Most people consider indices a reasonable barometer of diversified exposure to a given asset class. However, within U.S. large-cap growth, this is arguably not the case.
It’s Getting Crowded in Here
As a proxy for the U.S. large-cap growth market, Figure 1 depicts the weight of the five largest Russell 1000 Growth Index (the “Index”) constituents since the Tech Bubble in 2000, the last instance at which the top five holdings in the benchmark were as comparably high as they are today.1
Figure 1: % Market Value of Russell 1000 Growth Index Top Five Constituents
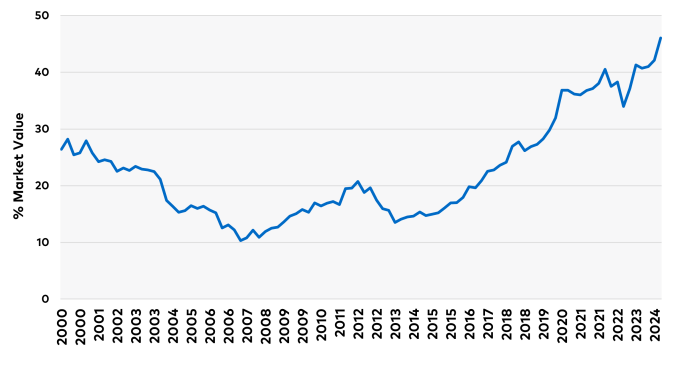
Source: Bloomberg. Data from 3-31-2000 to 6-30-2024. Includes observations of top 5 holdings in the Russell 1000 Growth, rebalanced quarterly.
Currently, ~46 % of the Index’s market value is accounted for by the top five holdings: Microsoft, Apple, NVIDIA, Alphabet, and Amazon. The factors behind this unusual phenomenon vary, in our opinion. The generally low interest rate environment over the past decade, breakthrough innovations, the emergence of platform businesses, and winner-take-all (or most) market dynamics are all possible explanations beyond this piece’s scope.
2H2023-1H2024: A one-two punch of concentration and narrow markets
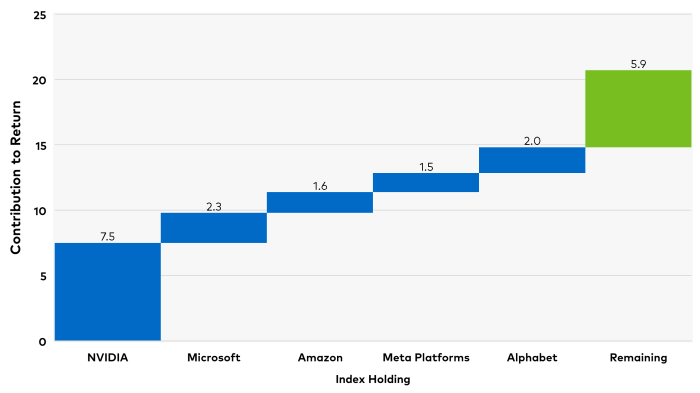
In the first half of 2024, the dominant narrative in markets—far and away—was around generative artificial intelligence (GenAI). Companies perceived to be GenAI beneficiaries have seen their share prices markedly outperform those where the benefit is less evident in the immediate term. This is notable because it adds another layer to an already concentrated market with increasingly narrow leadership. As a measure of concentration, NVIDIA, Microsoft, Amazon, Meta Platforms, and Alphabet accounted for 72% of the Russell 1000 Growth's 20.7% return in 1H24, as shown in Figure 2.
Figure 2: 72% of the Russell 1000 Growth Index Return Driven by Five Stocks
Source: eVestment U.S. large-cap growth universe of active managers. Data shown 6-30-2000 through 3-31-2008 to capture the unwinding of extreme market concentration. Blue bars are individual manager excess returns gross of fees, comprising 134 data points; the median manager excess return is denoted by the green line.
As a measure of narrowness, only 21% of companies outperformed the headline return on the Index, with the average stock underperforming the Index by -15.6%2. Speaking to the GenAI narrative, nearly half of the Index return came from the Semiconductor industry alone, deemed to be the most apparent GenAI beneficiary. In many cases, the success, or lack thereof, of a given active manager in 1H24 came down to positioning around a handful of companies, most of which had direct ties to the GenAI theme.
Possible Pitfalls of Passive
As markets stand today, passive benchmark investors may be unwittingly accepting an unfavorable risk/reward scenario. Experience has shown us that consistent earnings growth year after year drives share prices. However, overpaying for growth that proves to be less durable adds another layer of risk. We think many would acknowledge that Microsoft, Apple, NVIDIA, Alphabet, and Amazon are among the most competitively advantaged companies worldwide. At the same time, this does not mean that each of these companies individually offers an attractive risk/reward now. And therein lies the risk for investors, based on our research. The large collective weight of these five businesses in the Russell 1000 Growth Index means that passive investors will see their prospective returns heavily influenced by the performance of these holdings.
If history is a guide, then investors would be wise to take a more nuanced approach, in our opinion. As noted previously, the last instance in which the Index was this concentrated occurred in June 2000 . When the Tech Bubble burst in the early 2000s, the concentration in the Russell 1000 Growth Index (using the top five holdings as a proxy) declined for a prolonged period until it bottomed eight years later in March 2008.
Figure 3 shows the individual manager excess returns of the eVestment U.S. large-cap growth peer universe. Over this period of peak-to-trough concentration, the median U.S. large-cap growth active manager outperformed the Russell 1000 Growth by 4.8% annualized, gross of fees, and over 90% of active managers outperformed.
In other words, as the concentration of the Index’s top five holdings slowly deflated between 2000-2008, this period proved to be a favorable environment for active growth managers. In our view, the most likely explanation for this is that active managers weren’t anchored to the top weights in the Index like their passive brethren, as those top weights collectively underperformed the benchmark.
Figure 3: Annualized Excess Return of U.S. Large Cap Growth Active Managers, 6-30-2000 to 3-31-2008
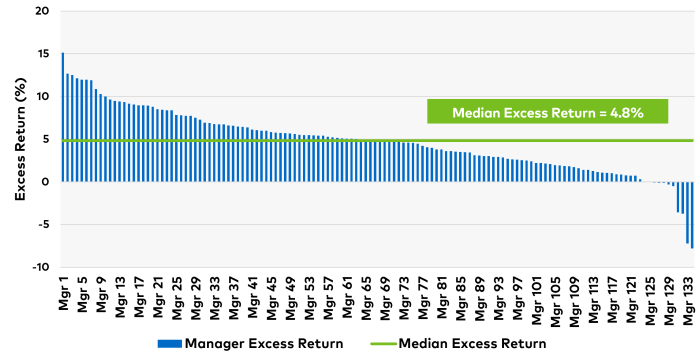
Source: eVestment U.S. large-cap growth universe of active managers. Data shown 6-30-2000 through 3-31-2008 to capture the unwinding of extreme market concentration. Blue bars are individual manager excess returns gross of fees, comprising 134 data points; the median manager excess return is denoted by the green line.
We are not suggesting that one should categorically avoid or underweight the top five Index companies. However, history suggests that the high concentration level among the top holdings in the Index may not persist. If this is true going forward, it implies that some of these large Index positions will underperform. To us, this argues for a more balanced approach to investing across a spectrum of growth companies: those that generate high growth quickly and those that grow at slower but steadier rates, which we call “safeties.” In our experience, this combination of safety and faster growth creates resilient portfolios that can weather quickly changing market conditions.
Investing Across the Growth Spectrum

More Space for Active Management
Today, passive investors are effectively betting on the go-forward success of a small subset of companies that, in some cases, may offer a less attractive risk/reward trade-off than they realize. Previous market history illustrates the pitfalls of being anchored to a top-heavy index. By contrast, active management may be well positioned to navigate quick shifts in market dynamics should the next decade look different than the last.
Important Disclosures
1 The Tech Bubble was a rapid rise in U.S. technology stock equity valuations fueled by investments in Internet-based companies in the late 1990s. During this period, the S&P peaked in Mar-2000 and bottomed in Oct-2002.
2 Source: Bloomberg. Data from 12-31-2023 to 6-30-2024.
3 Source: Blomberg. Data examined from 3-31-2000 to 6-30-2024.
This information has been prepared by Polen Capital without taking into account individual objectives, financial situations or needs. As such, it is for informational purposes only and is not to be relied on as, legal, tax, business, investment, accounting, or any other advice. Recipients should seek their own independent financial advice. Investing involves inherent risks, and any particular investment is not suitable for all investors; there is always a risk of losing part or all of your invested capital.
No statement herein should be interpreted as an offer to sell or the solicitation of an offer to buy any security (including, but not limited to, any investment vehicle or separate account managed by Polen Capital). This information is not intended for distribution to, or use by, any person or entity in any jurisdiction or country where such distribution or use would be contrary to local law or regulation.
Unless otherwise stated, any statements and/or information contained herein is as of the date represented above, and the receipt of this information at any time thereafter will not create any implication that the information and/or statements are made as of any subsequent date. Certain information contained herein is derived from third parties beyond Polen Capital's control or verification and involves significant elements of subjective judgment and analysis. While efforts have been made to ensure the quality and reliability of the information herein, there may be limitations, inaccuracies, or new developments that could impact the accuracy of such information. Therefore, the information contained herein is not guaranteed to be accurate or timely and does not claim to be complete. Polen Capital reserves the right to supplement or amend this content at any time but has no obligation to provide the recipient with any supplemental, amended, replacement or additional information.
Any statements made by Polen Capital regarding future events or expectations are forward-looking statements and are based on current assumptions and expectations. Such statements involve inherent risks and uncertainties and are not a reliable indicator of future performance. Actual results may differ materially from those expressed or implied.
There is no assurance that any securities discussed herein are currently held in a Polen Capital portfolio nor that they are representative of the entire portfolio in which they are or were held. It should not be assumed that any transactions related to the securities discussed herein were (or will prove to be) profitable or that any future transactions will equal the investment performance of the securities discussed herein.
References to specific securities, asset classes and financial markets are for illustrative purposes only and are not intended to be, and should not be interpreted as, recommendations.
Past performance is not indicative of future results.
This information may not be redistributed and/or reproduced without the prior written permission of Polen Capital.
The Russell 1000® Index is a market capitalization weighted index that measures the performance of the large-cap segment of the U.S. equity universe. It is comprised of 1,000 of the largest securities in the Russell 3000® Index. The index is maintained by the FTSE Russell, a subsidiary of the London Stock Exchange Group. It is impossible to invest directly in an index. The performance of an index does not reflect any transaction costs, management fees, or taxes.
Contribution to total return is a measure of a securities' contribution to the total return of a portfolio or index. The calculation can be approximated by the below formula, taking into account purchases and sales of the security over the measurement period. Contribution to total return of Stock A = (Stock A weight (%)) x (Stock A return (%)).
All company-specific information has been sourced from company financials as of the relevant period discussed.