Parsing Risk and Reward in High Yield Investing

Key Takeaways
- Leveraged credit markets compensate investors for risks beyond default loss
- A healthy liquidity premium exists for both high yield bonds and leveraged loans, which is even more pronounced in smaller issue sizes
- Large managers are often unable or unwilling to seize these opportunities
- Investors with flexibility and appropriate time horizons stand to benefit from the risk/reward profile of leveraged credit investments
In the high yield and leveraged loan space, just like any other market, investors expect fair compensation for the risks they incur. Ask even a novice on the subject, and they will likely cite credit risk as the primary risk associated with high yield investing. We agree that credit risk is vital to assess. However, it’s just one part of the equation. In addition to the risk premium associated with the likelihood of default, leveraged credit markets provide investors with excess spread to compensate for the relative liquidity of these markets.
During the last ten years, the average spread for the high yield bond and leveraged loan market has been 440 basis points (bps) and 510 bps, or 4.4% and 5.1%, respectively. During the same period, average default rates in both markets were approximately 2%, while recovery rates for high yield bonds at 38.0% lagged those of leveraged loans, which averaged 55.6%. Accordingly, in the event of a default, while an investor in the predominantly unsecured high yield bond market can expect to lose 62 cents on the dollar, an investor in the predominantly secured leveraged loan market would lose only 44.4 cents on the dollar. Multiplying these loss rates by the average annual default rates, we get default loss. Default loss can be thought of as the average compensation for credit risk, which in the context of an average spread of 4.4% and 5.1%, leaves a meaningful amount of “unexplained” excess spread earned for investing in below-investment grade credit markets (Figure 1).
Figure 1: Decomposing Risk & Reward Over the Last 10 Years

As of March 31, 2024. Source: ICE, Credit Suisse, and J.P. Morgan.
The explanation is that much of this excess spread compensates investors for participating in a less-liquid asset class, which is called the liquidity premium. Even during environments of heightened default activity, it is often liquidity risk that accounts for much of the spread earned for investing in below-investment grade debt.
For example, we can look at 2020, the most recent year for a spike in defaults. On March 31, 2020, spreads stood at 859 bps and 974 bps for high yield bonds and leveraged loans, respectively. If we apply the same calculations as above, we see in Figure 2 that excess spread accounts for most of the compensation an investor ultimately received under the default conditions in 2020.
Figure 2: Decomposing Risk & Reward in 2020
Source: ICE, Credit Suisse, and J.P. Morgan.
Importantly, the severity of the 2020 default wave was muted because of the unprecedented fiscal and monetary policy measures taken to support market functioning. However, it does not change the general observation that spreads compensate for more than credit risk.
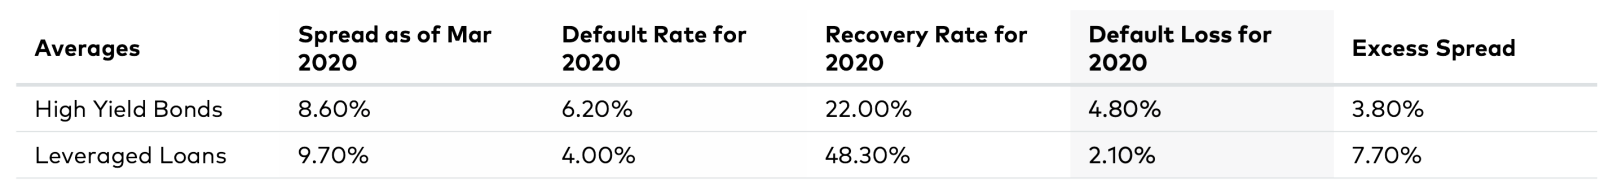
With the liquidity premium for the broader market established, we can peel back another layer and assess liquidity premiums at the issue level. As one might expect, as issue size declines, liquidity premium in the high yield bond market increases (Figure 3). While the premium can ebb and flow over time, during the last ten years, the spread premium between issues $201M-$300M in size and issues greater than or equal to $1001M has averaged 139 bps.
Figure 3: High Yield Bond Liquidity Premium: Spread by Issue Size, Trailing 10 Years
As of March 31, 2024. Source: ICE, ICE BofA U.S. High Yield Index.
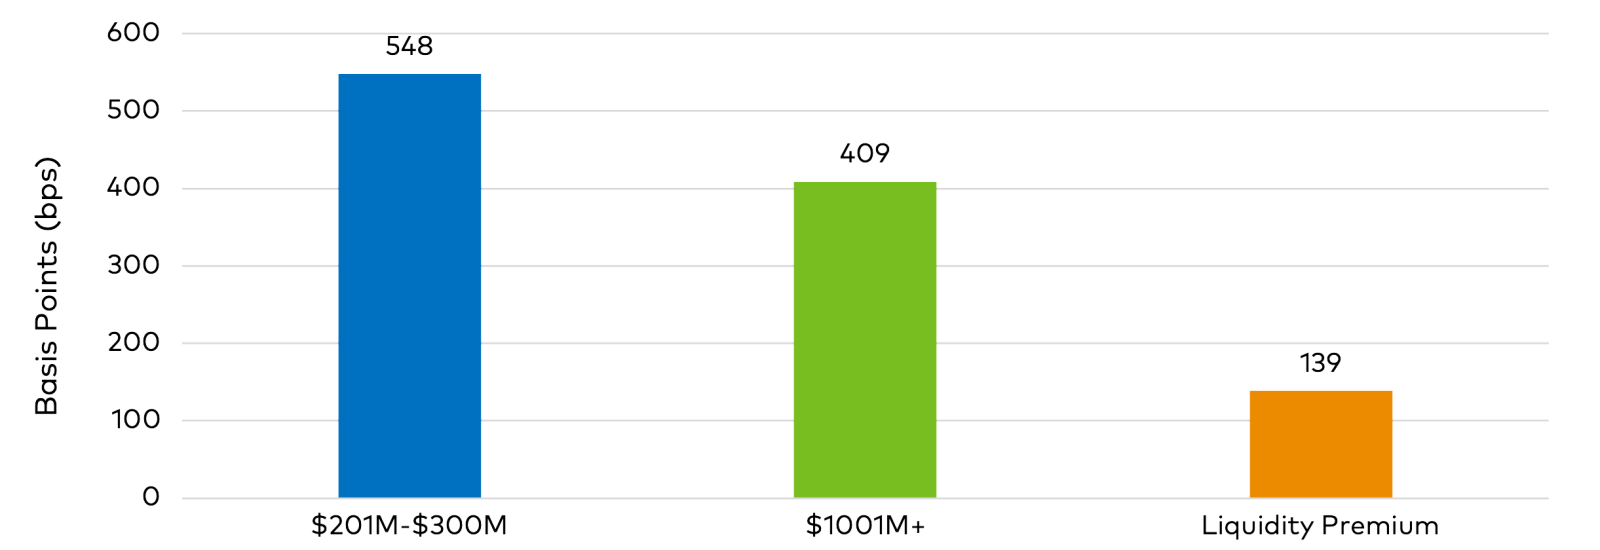
Moreover, within the leveraged loan market, smaller issue sizes have offered an even greater liquidity premium relative to their larger peers than that offered in the high yield bond market. On average, the spread premium provided by loan deals $101M-$200M and $201M-$300M in size over the last ten years was 445 bps and 247 bps, respectively (Figure 4).1
Figure 4: Leveraged Loan Liquidity Premium: Spread by Issue Size Trailing 10-Years
As of March 31, 2024. Source: CSLL, Credit Suisse Leveraged Loan Index
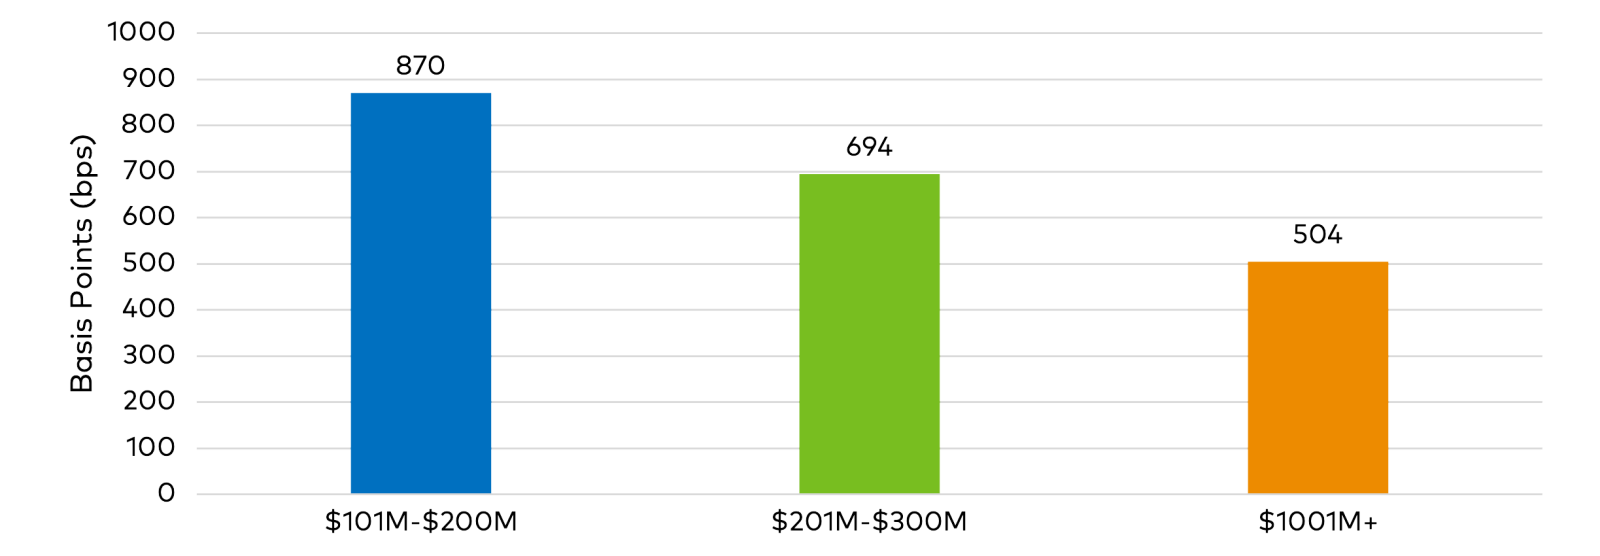
To further the point, Figure 5 compares the performance of the ICE BofA U.S. High Yield Index to that of the iBoxx USD Liquid High Yield Index. The latter only includes high yield bonds with at least $400 million outstanding, while the former includes deals smaller than the iBoxx threshold. During the ten years ending March 31, 2024, the broader index outperformed the iBoxx index by more than 50 bps per year. While the 3-year performance differential between the two indices is much closer, a return premium remains. Moreover, during the most recent 5-year period, the broad market index outperformed the liquid high yield index illustrating the value of investing in smaller deal sizes.
Figure 5: Annualized Trailing Performance: Broad High Yield vs. Liquid High Yield
As of March 31, 2024. Source: Bloomberg.
Many larger investors in the high yield bond and leveraged loan market often view smaller deal sizes as unattractive. In the high yield bond market, large benchmark-centric mandates and ETFs target higher-rated larger issue sizes that provide greater liquidity at the cost of lower spreads. Similarly, collateralized loan obligations, which are the largest buyers of leveraged loans, also place a premium on size, as they find larger deals more suitable for their risk-reward objectives. These preferences create mispricings in both markets and provide an opportunity for active managers with more flexible mandates to capitalize on this inefficiency.
As we have shown, much of the compensation received for investing in below-investment grade credit markets rewards risks beyond the loss of principal. Further, we believe a persistent opportunity exists to capture a liquidity premium by investing in smaller deals within the high yield bond and leveraged loan universe. While smaller high yield bonds offer an attractive size premium, an even greater potential reward exists among leveraged loans. However, this note began by highlighting that an assessment and thorough understanding of credit risk is paramount. The liquidity premium loses its worth if one cannot protect the principal value of the investment. That said, we believe that both markets offer an enticing opportunity for patient investors who have the flexibility and appropriate time horizons necessary to capture this healthy liquidity premium.

Important Disclosures
1In October 2016, ICE index services instituted a rule that excluded deals smaller than $250M in size from the ICE BofA U.S. High Yield Index, thus the exclusion of the $101M-$200M deal size group from Chart 1. However, from 3/31/2013 through 9/30/2016, high yield bond deals of that size offered an average liquidity premium of 248 bps relative to deals $1000M in size.
This information is provided for illustrative purposes only. Opinions and views expressed constitute the judgment of Polen Capital as of May 2024 and may involve a number of assumptions and estimates that are not guaranteed and are subject to change without notice or update.
Although the information and any opinions or views given have been obtained from or based on sources believed to be reliable, no warranty or representation is made as to their correctness, completeness, or accuracy. Opinions, estimates, forecasts, and statements of financial market trends that are based on current market conditions constitute our judgment and are subject to change without notice, including any forward-looking estimates or statements which are based on certain expectations and assumptions. The views and strategies described may not be suitable for all clients.
This document does not identify all the risks (direct or indirect) or other considerations which might be material to you when entering any financial transaction. Past performance does not guarantee future results and profitable results cannot be guaranteed.
The volatility and other material characteristics of the indices referenced may be materially different from the performance achieved by an individual investor. In addition, an investor’s holdings may be materially different from those within the index. Indices are unmanaged and one cannot invest directly in an index.
The ICE BofA U.S. High Yield Index tracks the performance of U.S. dollar-denominated below investment grade corporate debt publicly issued in the U.S. domestic market.
The Credit Suisse Leveraged Loan Index tracks the investable market of the U.S. dollar-denominated leveraged loan market. It consists of issues rated “5B” or lower, meaning that the highest rated issues included in this index are Moody’s/S&P ratings of Baa1/BB+ or Ba1/BBB+. All loans are funded term loans with a tenor of at least one year and are made by issuers domiciled in developed countries.
The Markit iBoxx USD Liquid High Yield Index consists of liquid U.S. dollar-denominated high yield bonds, selected to provide a balanced representation of the USD high yield corporate bond universe.
20240509-3569706