The Polen Equity Heat Map: Factors in Degrees of Expected Return
A Guide to Expected Equity Return Scenarios
At Polen Capital, the value of truly understanding a business cannot be overstated. We believe that a company’s earnings growth is a critical factor that dictates long-term stock returns. Thus, we focus our efforts on deeply understanding a company’s business fundamentals, its growth prospects, and the sustainability of that growth. We then assess valuation and a company’s ability to withstand market fluctuations.
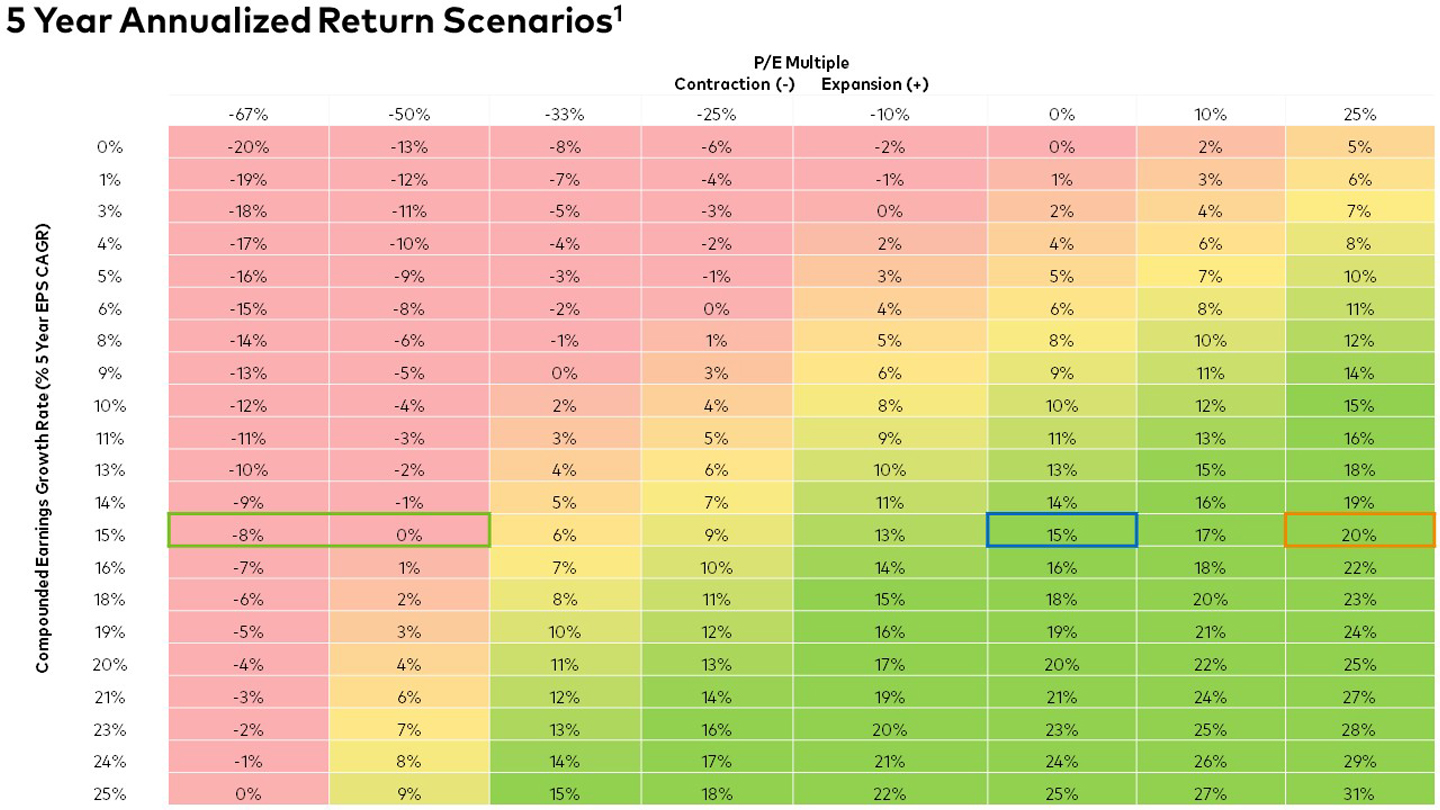
We visualize this concept using the Polen Equity Heat Map below. Through a growth lens, we evaluate the long-term expected return potential of a company and our portfolios.
Interpreting the Polen Equity Heat Map
- The y-axis: Compounded earnings growth rate of a company over a five-year period. Over the long term, we believe that earnings growth is a key determinant of expected returns (x, y) and has a solid correlation with long-term market returns.
-
The x-axis: % change in P/E multiple over a five-year period. The P/E multiple is the price investors are willing to pay per dollar of earnings. In the short term, the market might be swayed by various external factors like news and sentiment. These factors can positively or negatively influence the P/E multiple. Long term, we observe that the market factors in company fundamentals, and returns primarily reflect a company’s earnings trajectory (the y-axis).
- Result (x, y): Expected return.
The Potential Advantage of Targeting Double-Digit Growth
We target a mid-teens earnings growth rate or higher for our portfolios, and our analysis must indicate this same growth threshold for any company we invest in. This double-digit growth threshold can provide a potential cushion amid periods of market and multiple contraction.
We first seek to ensure we have identified companies that are rooted in our five investment guardrails:
- Strong balance sheet
- High ROE
- Organic revenue growth
- Abundant free cash flow
- Stable/improving margins
Then, we ensure we are paying an attractive valuation. This investment discipline demonstrates why we believe the margin of safety lies in the business. It’s also why we believe we can invest in compelling companies at a discount to their intrinsic value but also reap the benefits of wide competitive moats, sound financials, and durable earnings growth.
Important Disclosures
1 Excludes dividends
The y-axis = EPS CAGR over five-year period. EPS (earnings per share) measures a company’s profits per share of stock. CAGR (compounded annual growth rate) is the average annual growth rate over time. Together, the EPS CAGR is the annual rate at which a company grows it earnings per share.
The x-axis = % change in P/E multiple for a five-year period. The P/E multiple or ratio measures the price investors are willing to pay per dollar of earnings. It can be used to determine a company’s valuation. In times of multiple expansion, investors pay more per dollar of earnings and the reverse is true in times of multiple contraction. This affects expected returns for a particular investment.
Opinions and views expressed constitute the judgment of Polen Capital as of February 2024 may involve a number of assumptions and estimates which are not guaranteed and are subject to change without notice or update. Although the information and any opinions or views given have been obtained from or based on sources believed to be reliable, no warranty or representation is made as to their correctness, completeness or accuracy. Opinions, estimates, forecasts, and statements of financial market trends that are based on current market conditions constitute our judgment and are subject to change without notice, including any forward-looking estimates or statements which are based on certain expectations and assumptions. The views and strategies described may not be suitable for all clients. This document does not identify all the risks (direct or indirect) or other considerations which might be material to you when entering any financial transaction.
This page is not intended as a guarantee of profitable outcomes. Any forward-looking estimates are based on certain expectations and assumptions that are susceptible to changes in circumstances.
Past performance does not guarantee future results and profitable results cannot be guaranteed.
Methodology and Assumptions:
The calculation methodology assumes that the 5-year EPS CAGR will match 5-year annualized return excluding dividends if there is no change in the P/E multiple. The calculation is as follows: [(1+% Change in PE Multiple)*[(1+EPS CAGR)5]1/5.
There are numerous other factors which have not been fully accounted for in the preparation of these results which could adversely affect actual results. There is no guarantee that performance will follow earnings growth.
This example is for illustrative purposes only and has been prepared based on assumptions believed to be reasonable; however, there is no guarantee that any forecasts made will come to pass. There may be several unexpected developments and market factors which may affect these scenarios, potentially adversely. There are certain inherent limitations. No representation is being made that any investment will or is likely to achieve future results similar to those shown.
This information is not intended to be construed to equate to the expected or projected future performance/returns of a Polen Capital investment or portfolio.