The Polen High Yield Heat Map: Degrees of Expected Return
At Polen Capital, we stress understanding the value of the businesses in which we invest. We believe that a company’s ability to generate free cash flow through its business cycle is a critical factor in determining its capacity to meet its debt obligations and avoid default. We focus our efforts on deeply understanding a company’s business fundamentals, its growth prospects, and the sustainability of its free cash flow. We then assess valuation and a company’s ability to withstand fluctuations in market conditions.
We target debt instruments that offer a yield premium to the broader market, and our rigorous due diligence process is designed to mitigate the loss of principal (associated with default events or otherwise). This yield premium can provide a cushion amid periods of market dislocation and contribute to the strategy’s long-term outperformance.
We believe this investment discipline supports our ability to invest in compelling businesses with a meaningful margin of safety to their intrinsic value. Ultimately, we aim to construct portfolios with a significant yield premium to the broader market, without exposing them to incremental credit risk.
Download the Polen High Yield Heat Map

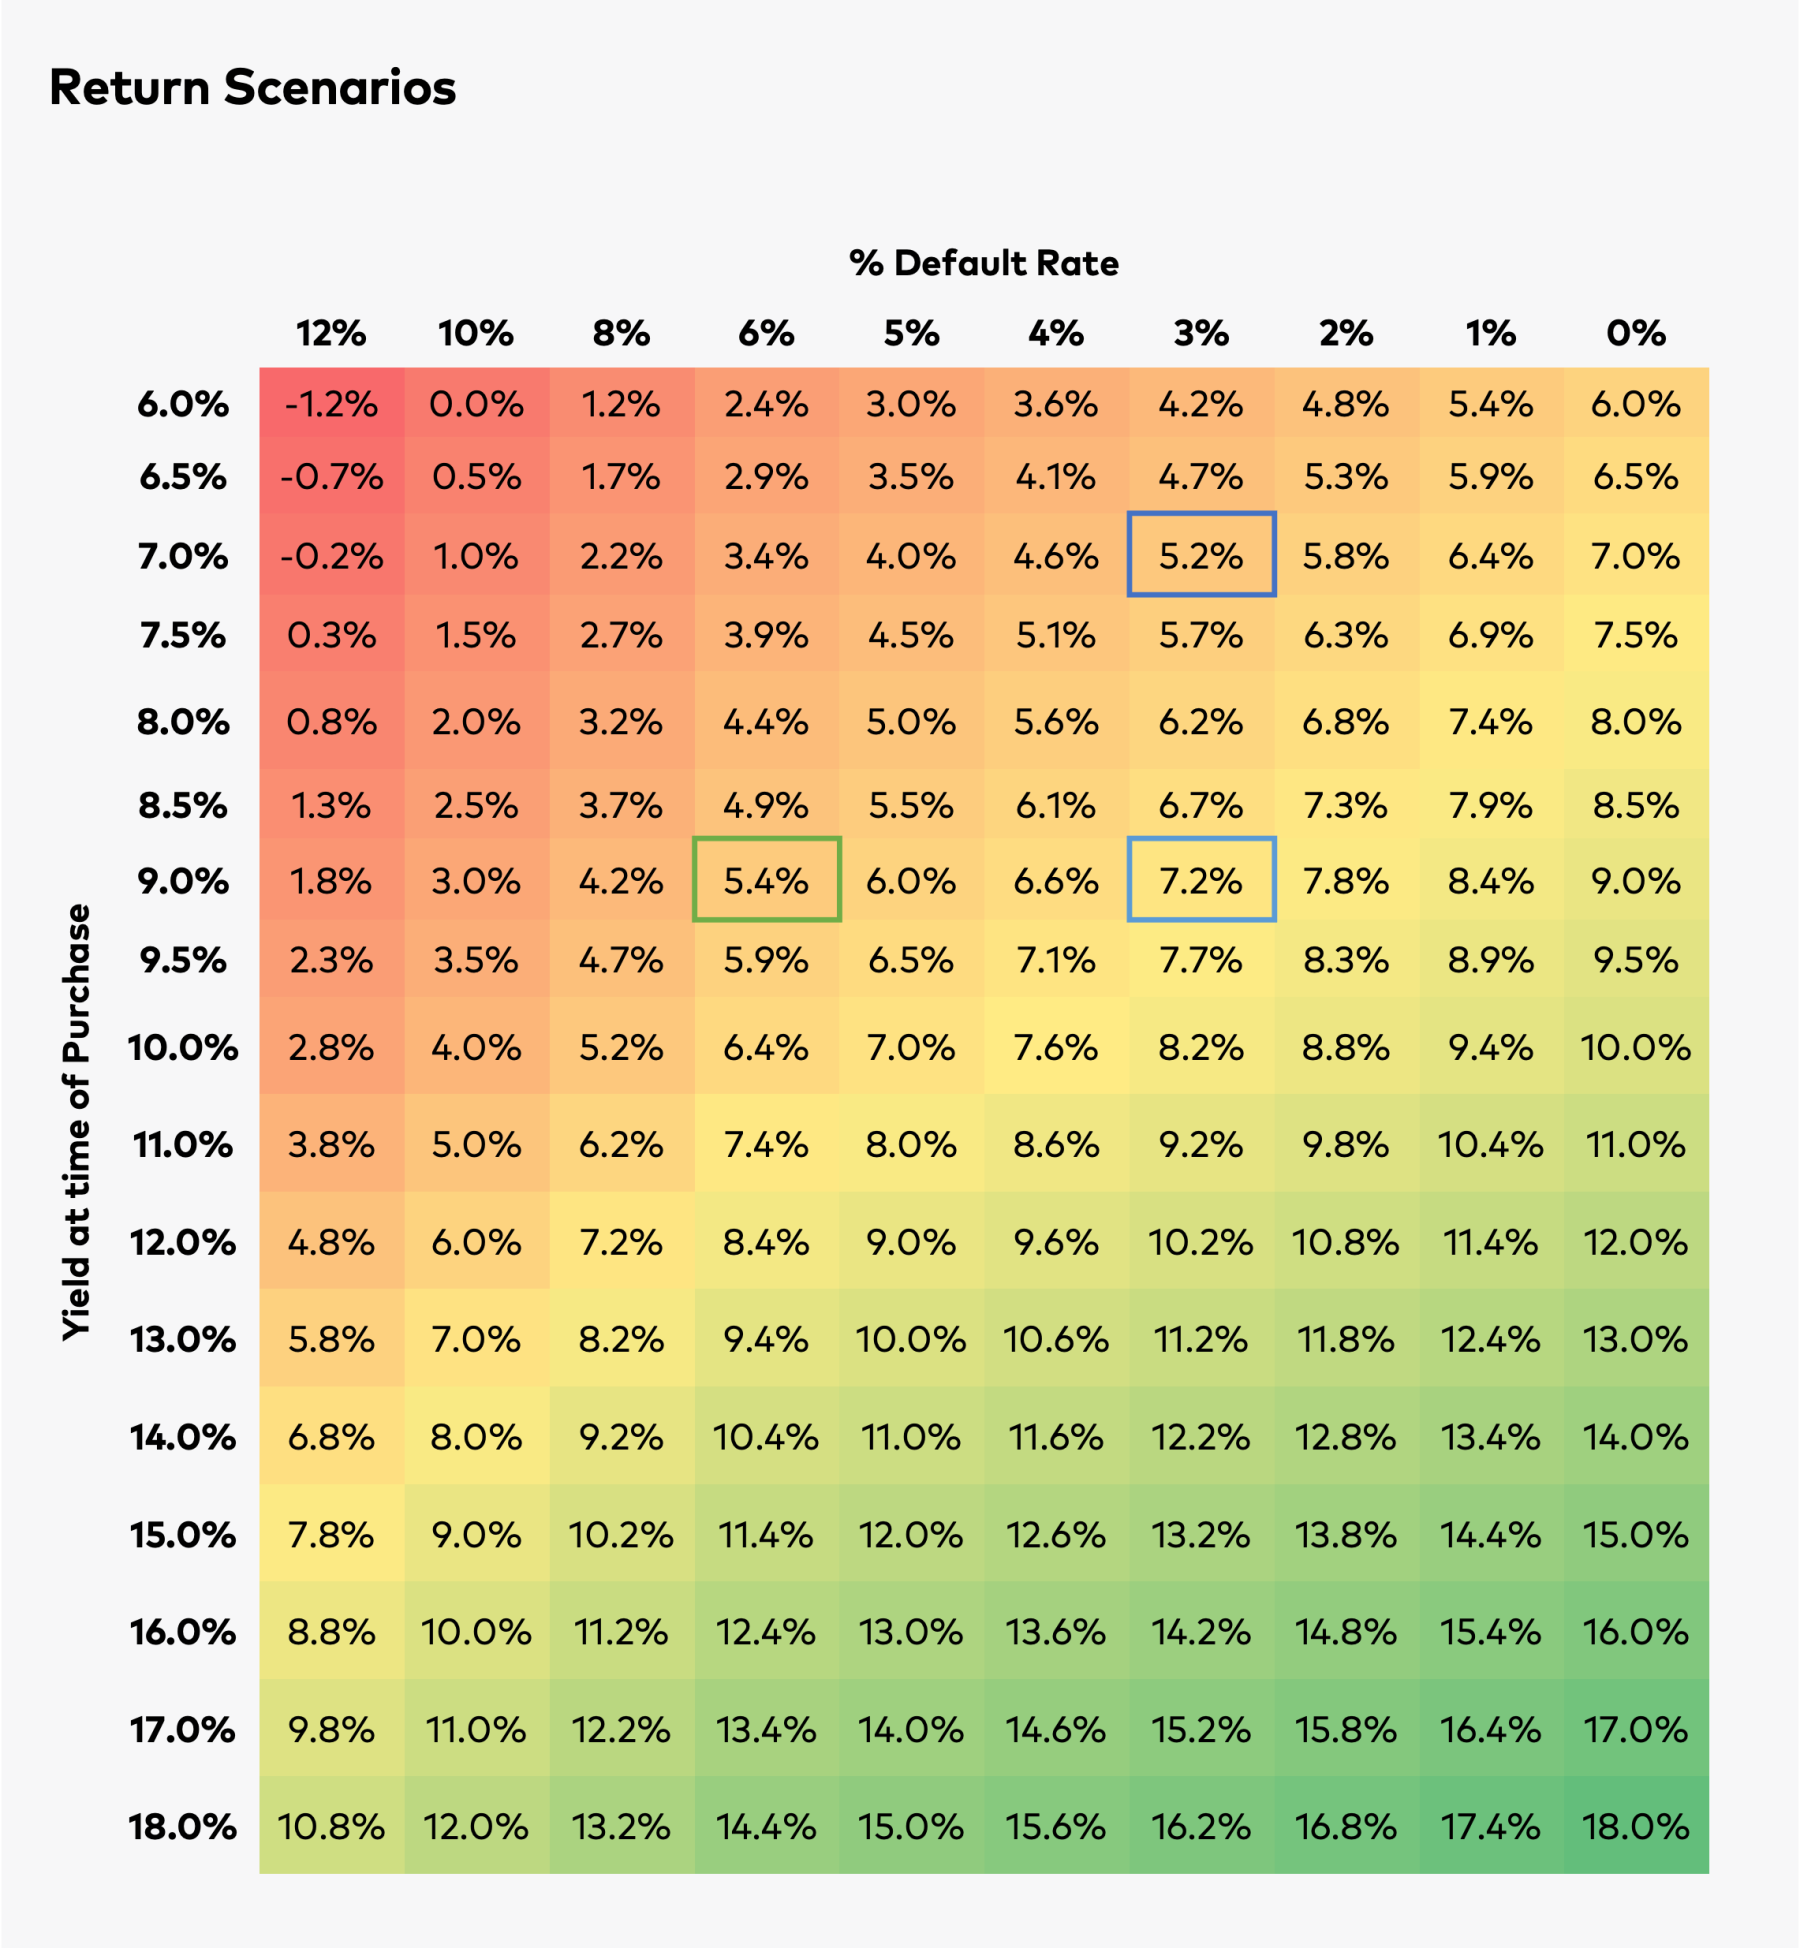
Interpreting the Heat Map
- The y-axis: The yield of the high yield market, or a typical portfolio managed by Polen Capital pursuing a high yield strategy. The yield serves as the expected return of either the high yield market or such portfolio assuming no default losses.
- The x-axis: The Default Rate Percentage. The Default Rate Percentage represents the annual percentage of the high yield market, or a portfolio managed by Polen Capital pursuing a typical high yield strategy, that defaults annually. Over the short term, both the high yield market, and the portfolio, can be influenced by external factors. However, over the long term, we have observed that company fundamentals are a more important determinant of performance. Therefore, we believe that getting the credit story correct among higher-yielding opportunities, thereby minimizing default losses, provides the portfolio with the opportunity to outperform the broader high yield market.
- Result (x,y): Expected return.
Important Disclosures
Opinions and views expressed constitute the judgment of Polen Capital as of November 2024 and may involve a number of assumptions and estimates that are not guaranteed and are subject to change without notice or update. Although the information and any opinions or views given have been obtained from or based on sources believed to be reliable, no warranty or representation is made as to their correctness, completeness or accuracy. Opinions, estimates, forecasts, and statements of financial market trends that are based on current market conditions constitute our judgment and are subject to change without notice, including any forward-looking estimates or statements which are based on certain expectations and assumptions. The views and strategies described may not be suitable for all clients. This document does not identify all the risks (direct or indirect) or other considerations which might be material to a client when entering any financial transaction.
Past performance does not guarantee future results and profitable results cannot be guaranteed.
Methodology and Assumptions:
The calculation methodology assumes that the Yield will match annualized return, reduced by default losses. Default losses are calculated assuming the 25-year annualized average recovery rate, which according to data gathered from J.P. Morgan is equal to approximately 40%. However, there are no assurances that the default losses actually incurred by the portfolio, and the associated recovery rates, will match this 25-year annualized recovery rate of 40%. The default loss calculation for the high yield market, assuming a 3% default rate and a 40% recovery rate, is as follows: 0.03*(1-.40) = 1.8%. The expected return calculation for the high yield market, based on such assumptions (as well as an assumed 7% yield), is as follows: (Yield – Default Loss), or (7% – 1.8%) = 5.2%.
There are numerous other factors that have not been fully accounted for in the preparation of these results and which could adversely affect actual results.
This example is for illustrative purposes only and has been prepared based on assumptions believed to be reasonable; however, there is no guarantee that any forecasts made will come to pass. There may be several unexpected developments and market factors that may affect these scenarios, potentially adversely. There are certain inherent limitations with a broad-based model of this nature that makes numerous assumptions. No representation is being made that any investment will or is likely to achieve future results similar to those shown.
This information is not intended to be construed to equate to the expected or projected future performance/returns of a portfolio managed by Polen Capital.
20241101-3991396