Emerging Markets: A Rare Window of Opportunity
High-quality businesses in some of the world’s fastest-growing nations currently trade at crisis-level discounts
Key Highlights
- Emerging market equities are trading at multi-decade discounts relative to U.S. equities in spite of a more favorable outlook.
- Within the emerging market universe, high-quality companies are at their cheapest valuations since the Great Financial Crisis.
- Despite the current opportunity set, investor portfolios are materially under-allocated to emerging markets.
Emerging Markets, Diverging Outlooks
It is often said that when the U.S. sneezes, the rest of the world catches a cold. Yet, following the pandemic, emerging market (EM) nations have proven incredibly resilient, recovering more rapidly than many of their advanced peers. Economists estimate this divergence to widen further in the coming years. According to Bloomberg, EM economies will expand by 4.1% in 2023 and 4.4% in 2024. In contrast, the U.S. is projected to grow by only 0.5% and 1.2%, marking the highest growth differentials in over a decade.
However, harnessing the growth potential present in EM is not as simple as one might imagine. Just because a region experiences economic growth, it does not necessarily follow that all local equities will perform well. As seen in Figure 1, EM equities have lagged behind developed markets (DM) in 11 out of the last 14 years despite delivering higher economic growth rates for the past two decades.
Figure 1: S&P 500 - MSCI Emerging Markets Index Annual Performance Spread
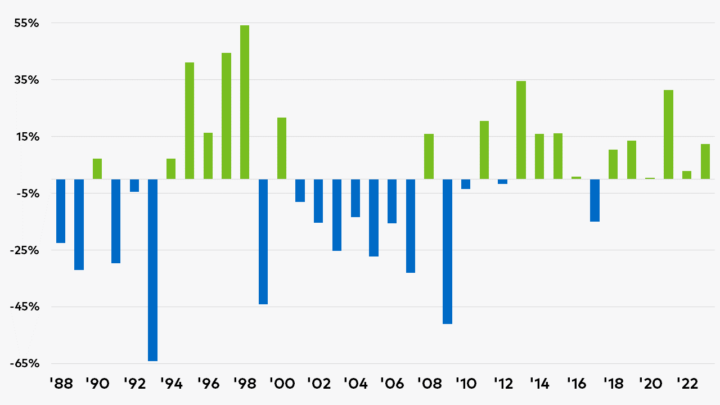
Source: Bloomberg. As of June 30, 2023.
Nevertheless, the relative underperformance in EM equities has resulted in some of the most attractive valuations versus developed markets in years. As Figure 2 shows, the MSCI Emerging Markets Index is currently valued at a rarely seen 55% discount relative to the S&P 500 despite EM equities benefitting from a stronger macroeconomic outlook, lower inflation, and more accommodative monetary policies.
Figure 2: MSCI Emerging Market Index Relative P/E Ratio vs. S&P 500
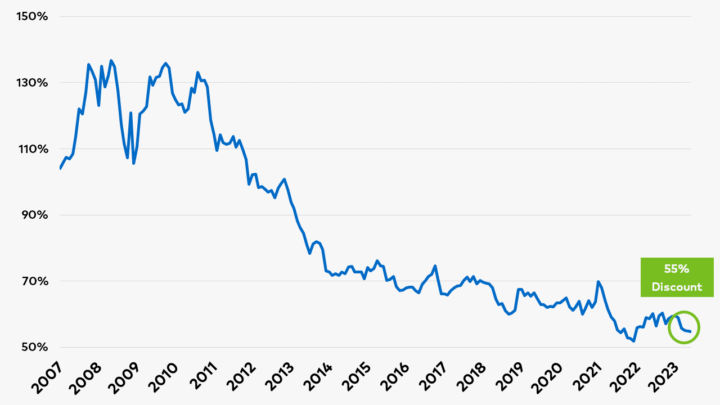
Source: Polen Capital, Bloomberg. Methodology: The relative P/E ratio is calculated by comparing the P/E ratio of the MSCI Emerging Market Index against that of the S&P 500 Index. As of June 30, 2023.
On Sale: Compounding Machines
A specific area of the EM universe where we currently see a compelling investment opportunity is the high-quality segment—represented by companies with the highest returns on invested capital (ROIC). ROIC is a measure that helps investors gauge how effectively management teams allocate capital to generate profits with high ROIC companies typically trading at a premium.
Figure 3 shows that companies in the top ROIC quintile have historically traded at an average of 1.2x times the broader market. This reflects that investors are generally willing to pay more for companies with robust fundamentals. However, the relative P/E of high-ROIC companies at the end of June was only 1.0x the rest of the Index. This indicates that the highest-quality companies in EM are priced similarly to low-quality businesses.
In our view, the low valuations of high-quality companies currently present long-term investors with a rare chance to become owners of some of the best businesses in the emerging world at prices that have only been seen during past crises such as the COVID-19 pandemic and the Great Financial Crisis of 2008/09.
Figure 3: MSCI Emerging Markets ROIC Relative 12-Month Forward P/E Ratio
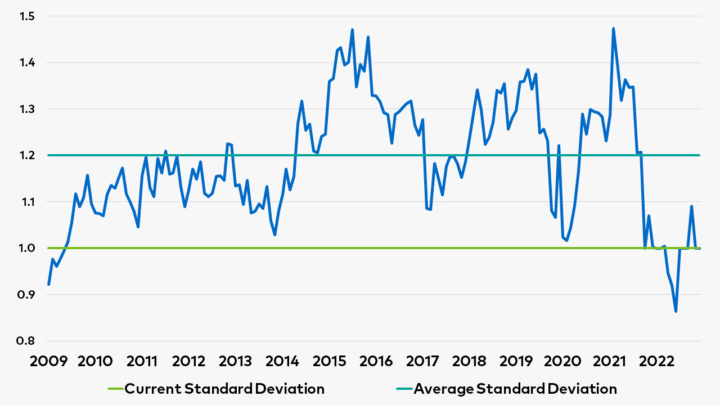
Source: Polen Capital, Bloomberg. Methodology: High-quality companies identified as companies in the top ROIC quintile of the MSCI Emerging Markets Index between July 2009 (end of the global financial crisis) and June 2023. The relative forward P/E ratio is calculated using Bloomberg’s weighted median of the 12-month forward P/E ratio of high-quality companies compared to that of the Emerging Market universe. As of June 30, 2023.
Investor Takeaways
In spite of the current opportunity in emerging markets, our analysis indicates that most portfolios today are under-allocated to the asset class, positioning them to miss out on future positive performance. Figure 4 shows that the current average global equity fund allocation to EM is 6.3%, far below the suggested 10.8% allocation implied by EMs weight in the MSCI ACWI Index and MSCI FM Index.
Figure 4: Share of EM in Global Indices vs. Actual Fund Allocation to EM Equities (% Weight)
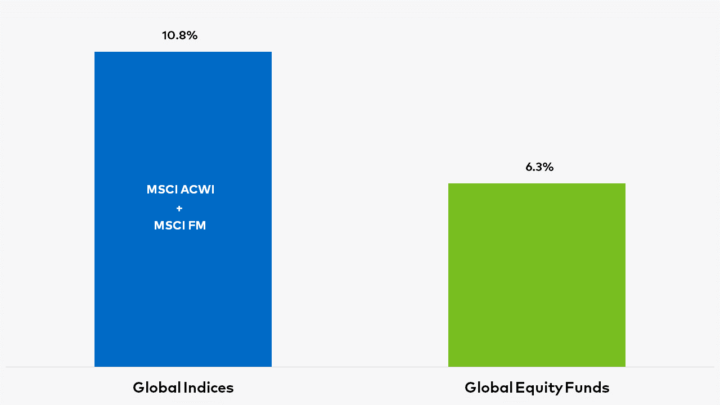
Source: Polen Capital, eVestment, Methodology: The EM Weight in Global Indices is generated from Bloomberg MSCI ACWI Index and MSCI Frontier Markets Index combined universe. The EM Weight in Global Equity Funds is generated from 1,093 eVestment global equity funds with a reported EM allocation of $294.5 billion. The EM Weight is calculated as the proportion of the total assets allocated to EM equities within the global equity fund allocations. As of March 2023.
However, the constructive backdrop in EM and lower equity valuation levels haven’t gone unnoticed by investors. According to Reuters, EM equity funds outpaced their DM peers in attracting inflows for the first time in three years1, underscoring a relatively more favorable growth outlook.
Unlocking the Power of Emerging Markets
At Polen Capital, our Emerging Markets investment team is dedicated to finding companies with competitive advantages that we believe can compound earnings and cash flows over the long term, independent of commodity swings or economic cycles. Given the power of compounding over time, we think that once we invest in great businesses, the best path forward is to stay the course through a long-term approach.
We believe this is particularly true in emerging markets, where unique risks occasionally arise that can create bumps in the road. Despite any near-term volatility, we remain excited about the long-term prospects in EM and would be surprised if today’s valuations do not go down as one of the best buying opportunities of the next decade for investors.
Important Disclosures
1 Refinitiv Lipper data shows money inflows into emerging market (EM) equity funds hit $30.55 billion in the first half of the year, compared with outflows of $88.65 billion from developed market equity funds (Reuters, July 14, 2023).
This information is provided for illustrative purposes only. Opinions and views expressed constitute the judgment of Polen Capital as of August 2023 and may involve a number of assumptions and estimates which are not guaranteed and are subject to change without notice or update. Although the information and any opinions or views given have been obtained from or based on sources believed to be reliable, no warranty or representation is made as to their correctness, completeness or accuracy. Opinions, estimates, forecasts, and statements of financial market trends that are based on current market conditions constitute our judgment and are subject to change without notice, including any forward-looking estimates or statements which are based on certain expectations and assumptions. The views and strategies described may not be suitable for all clients. This document does not identify all the risks (direct or indirect) or other considerations which might be material to you when entering any financial transaction.
The information in this document has been prepared without taking into account individual objectives, financial situations or needs. It should not be relied upon as a substitute for financial or other specialist advice. This document is provided on a confidential basis for informational purposes only and may not be reproduced in any form or transmitted to any person without authorization from Polen Capital Management.
Definitions
The Global Financial Crisis was a severe worldwide economic crisis. The National Bureau of Economic Research dates the recession around this crisis from Dec-2007 through Jun-2009.
The S&P 500® Index is a market capitalization weighted index that measures 500 common equities that are generally representative of the U.S. stock market. The index is maintained by S&P Dow Jones Indices.
The MSCI ACWI Index is a market capitalization weighted equity index that measures the performance of large and mid-cap segments across developed and emerging market countries. The index is maintained by Morgan Stanley Capital International.
The MSCI Emerging Markets Index is a market capitalization weighted equity index that measures the performance of the large and mid-cap segments across emerging market countries. The Index is maintained by Morgan Stanley Capital International.
The MSCI Emerging Markets Quality Index is based on the MSCI Emerging Markets Index, its parent index, which includes large and mid-cap stocks across 27 Emerging Markets (EM) countries. The Index aims to capture the performance of quality growth stocks by identifying stocks with high-quality scores based on three main fundamental variables: high return on equity (ROE), stable year-over-year earnings growth, and low financial leverage.
The MSCI Frontier Markets Index captures large and mid cap representation across 28 Frontier Markets (FM) countries. The index includes 98 constituents, covering about 85% of the free float-adjusted market capitalization in each country.
Past performance does not guarantee future results and profitable results cannot be guaranteed.