Understanding Quality in Small Company Investing
Polen’s investment team unpacks three essential dimensions of the businesses they seek when building portfolios.

The concept of quality has guided Polen Capital’s equity investment philosophy since the founding of our firm. In our experience, investors often disagree about what “quality” represents, especially in the nuanced landscape of small company investing. Here, we aim to provide a holistic understanding of what the term means to us and how it influences our research and decision-making process.
Looking to History as a Guide
Our foundational beliefs around quality have been forged over decades of investing experience. Two prominent events in financial history—the Tech Bubble of the early 2000s1 and the Global Financial Crisis (GFC)2—have helped to refine our beliefs on what constitutes a quality business. During the Tech Bubble, many companies faltered not for lack of a compelling strategic vision, but rather for an inability to execute effectively and sustain a viable business model. Subsequently, the GFC underscored the value of financial flexibility. In that punishing economic environment, profitable companies with robust balance sheets generally proved better equipped to maintain a long-term orientation and make necessary investments for sustainable growth, at a time when more vulnerable competitors had to re-trench.
In navigating the dynamic landscape of small cap investing, we recognize that the concept of quality extends beyond mere financial metrics. For us, quality cuts across three dimensions that we believe are inextricably linked: the business, the management team, and the reinvestment opportunity.
1. The Business: Competitive Advantages, Financial Flexibility
A quality business displays attributes that create conditions conducive to long-term value creation, in our view. A foundational element of a quality business is the existence of a competitive advantage or a uniqueness around the company’s business model that is difficult to replicate. While much of this assessment is qualitative, there are quantitative signposts to suggest a business may be unique, such as consistently high and/or improving gross margins. We believe this metric not only captures a potentially advantaged business but also enables the company to re-invest in the business through research & development, sales & marketing, or capital expenditures that can potentially lead to greater long-term value creation.
Besides having a durable competitive advantage, we believe a quality business must demonstrate financial flexibility. In our view, businesses that can self-fund growth and are not beholden to capital markets are of higher quality. During challenging periods, liquidity often dries up, and credit—if available—can be an expensive means of survival.
Financial flexibility enables a management team to consistently reinvest in the business to deepen its advantages and expand the addressable market. In contrast, businesses that lack financial flexibility often find themselves in the position of “stealing from their future.” By this, we mean that instead of investing for growth, they may be burdened with high interest costs or focused on preserving cash flow through short-term cost-cutting initiatives. As we see it, financial flexibility that stems from strong balance sheets and favorable free cash flow generation is a necessary condition to generate long-term value.
Along with balance sheet analysis, free cash flow is an important metric we use to determine financial flexibility. In contrast with accounting earnings which may be obscured by non-cash items, free cash flow presents a clear picture of the cash generated by the business after considering operating expenses, capital expenditures, changes in working capital, and cash taxes. As shown in the chart below, orienting towards profitable small companies as measured by free cash flow has provided a significant tailwind to long-term returns.
Figure 1: Free Cash Flow Positive Companies Have Outperformed Over Time
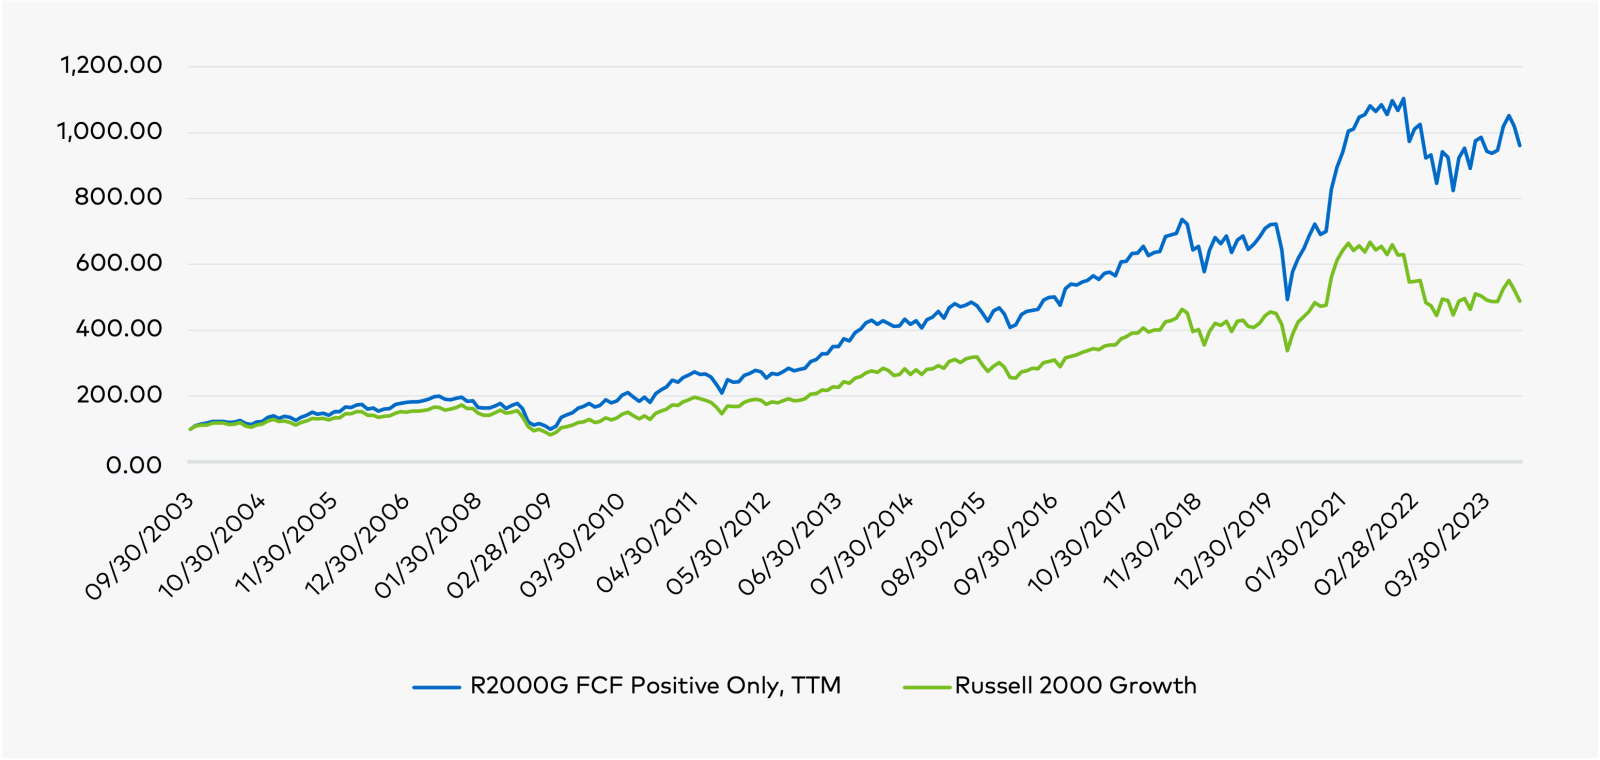
Source: Polen Capital, Bloomberg. Russell 2000 Growth is the starting universe and the chart presents back tested data. The blue line represents the cumulative return of the index constituents that were free cash flow positive over a trailing 12-month (TTM) period, rebalanced monthly over the past 20 years (9/30/2003 through 9/30/2023). The green line is the realized total return for the Russell 2000 Growth over the same period.
Having established what constitutes a quality business in our framework, we turn our attention to management teams. With a competitively advantaged business and abundant free cash flow, we evaluate how we believe the company leadership will operate the business and deploy capital.
2. The Management Team: Long-Term Focus, Disciplined Capital Allocation
We seek to invest in businesses with management teams that have a track record of making disciplined capital allocation decisions with a greater focus on the long term over the short term. In terms of metrics to evaluate management, at the top of the list for us is cash flow return on invested capital (CFROIC). This measures a company’s effectiveness in generating cash flow from the capital invested in the business. It strips out non-cash items, considers capital efficiency, and captures the impact of financial leverage in the capital structure. High CFROIC can signal a few things, not least of which is a management team that is effective at allocating capital. In a sense, it’s a scorecard that reflects strategic decisions over time aimed at maximizing shareholder value.
Over the long term, we have observed that the market rewards value creation as measured by CFROIC. The chart below segments the Russell 2000 Growth by highest CFROIC quintile to lowest and looks at annualized performance over a 20-year timeframe. The takeaway? It’s not just about investing in the highest CFROIC businesses, as those can often grow unsustainably. Instead, it’s about avoiding the bottom 40% of the universe and doing the deep work to identify companies with sustainable growth characteristics in the second and third quintiles.
Figure 2: Annualized Active Return by CFROIC Quintile (%), Russell 2000 Growth
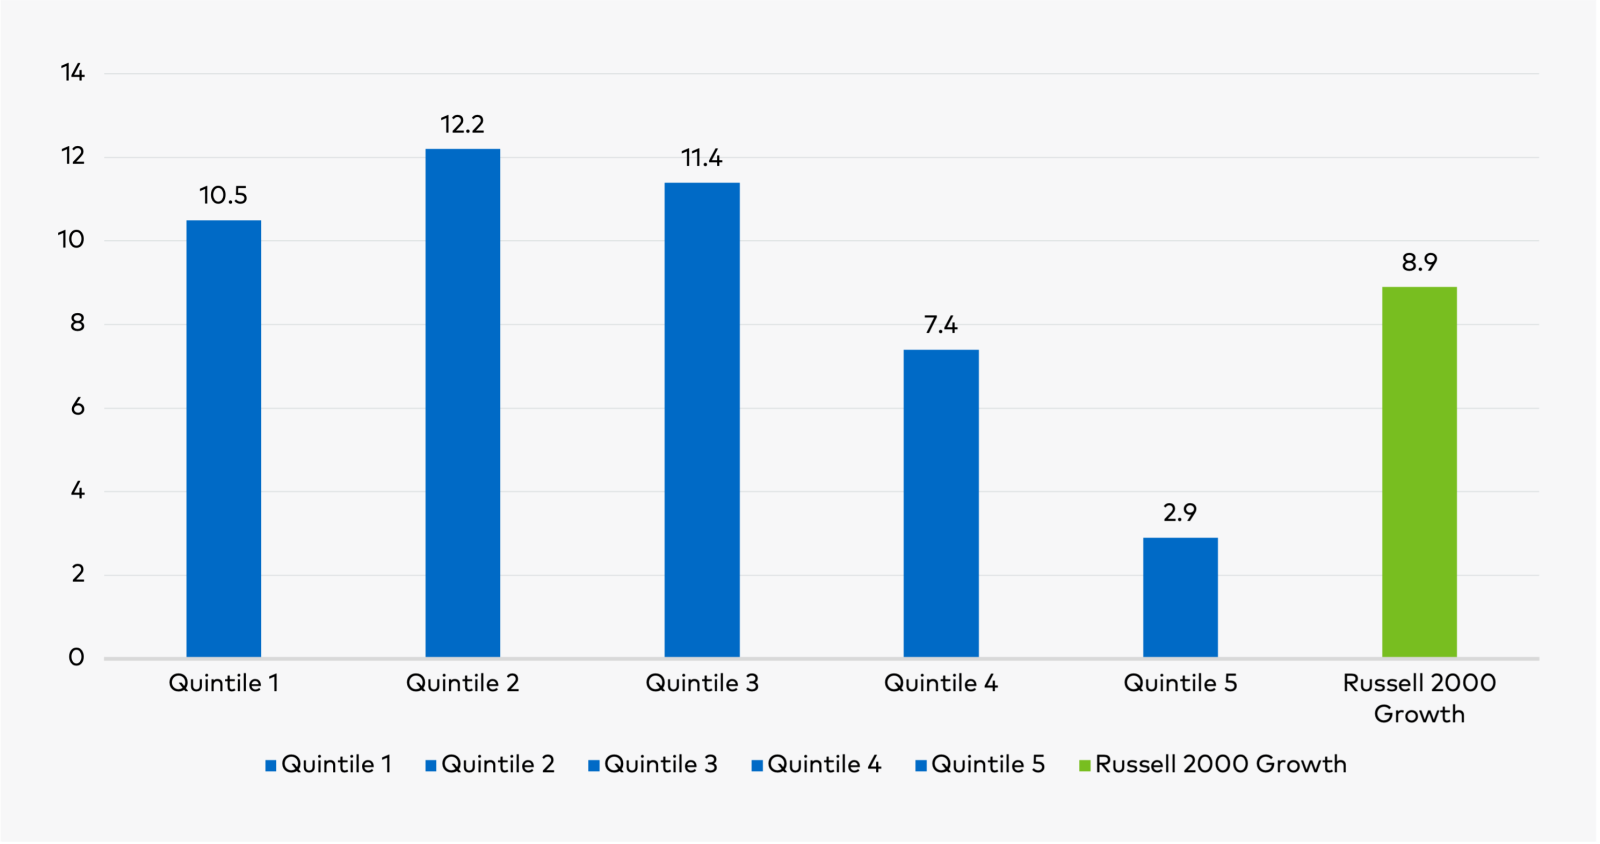
Source: Polen Capital, Bloomberg. Russell 2000 Growth is the starting universe, and the chart presents back tested data. The period shown is from 9/30/2003-9/30/2023. Blue bars segment the universe by CFROIC and provide the annualized return for that segment. The universe is segmented from the highest CFROIC (quintile 1) through the lowest (quintile 5). The green bar shows the overall return for the Russell 2000 Growth over this same timeframe.
Now that we have examined the conditions within the business and the management that may suggest a quality company, let’s turn to our final area of focus.
3. Reinvestment Opportunity: Return on Capital, Long Runway for Growth
A competitively advantaged business combined with an effective management team still requires a favorable reinvestment opportunity to meet our stringent quality hurdles. We look for two components of the reinvestment opportunity: return on capital relative to the core business and duration. For us, a key attribute of a great opportunity is one in which the return on capital is attractive relative to the historical returns the business has generated. This can often demonstrate that the company is strengthening its competitive position. Further, we seek companies that have opportunities to invest not only in the near term but for multiple years into the future.
An example from our portfolio is Five Below, which we believe has the potential to triple their store count over time given strong unit economics.3 We view this as an excellent use of cash flow, given the strong incremental return profile.
Figure 3: Number of Store Locations for Five Below
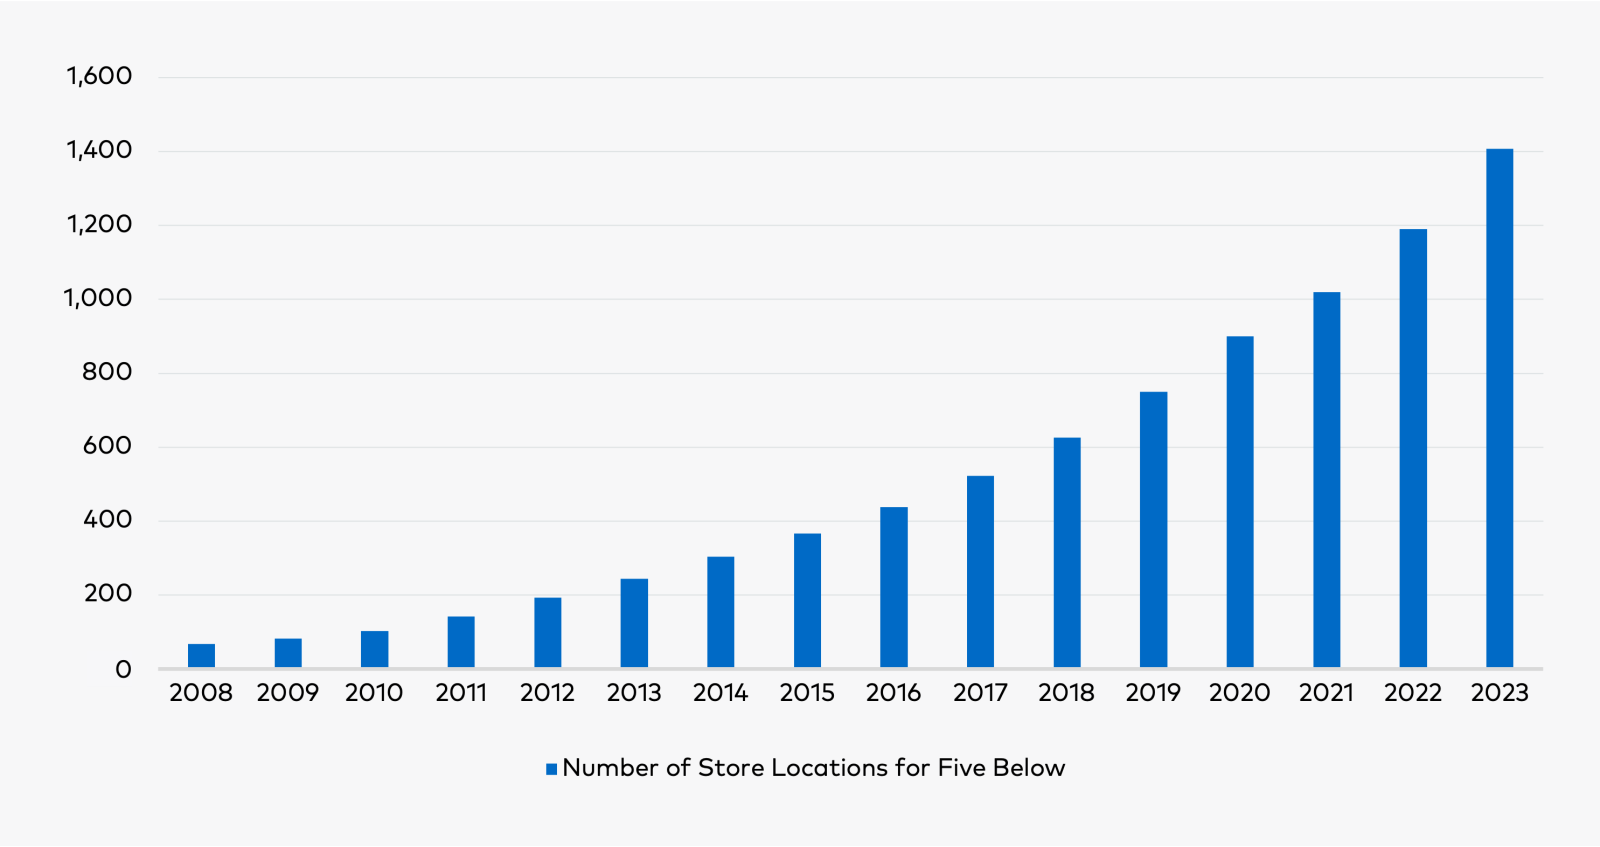
Source: Polen Capital, Bloomberg. As of latest company filing, for the period ended 7/29/2023.
Key Takeaways for Investors
For a small business to grow into a mid-sized or large business, many things must go right over time. A cursory look at the small cap universe reveals that most businesses are not set up for sustainable growth. As one measure of this, 50% of companies in the Russell 2000 Growth are unprofitable on a free cash flow basis, reducing their financial flexibility.4
We believe that maintaining a high bar around the quality of the business, management team, and opportunity set goes a long way toward improving the odds of success over time. A quality business—marked by a unique competitive advantage and a high degree of financial flexibility—can lay the groundwork for long-term compounding. From there, a skilled management team with a robust menu of reinvestment opportunities may help to optimize value creation for investors over the long term.
Important Disclosures
1The Tech Bubble was a rapid rise in U.S. technology stock equity valuations fueled by investments in Internet-based companies in the late 1990s. During this period, the S&P peaked in Mar-2000 and bottomed in Oct-2002.
2The Global Financial Crisis was a severe worldwide economic crisis. The National Bureau of Economic Research dates the recession around this crisis from Dec-2007 through Jun-2009.
3Five Below is a holding in Polen’s U.S. Small Company Growth, U.S. SMID Company Growth, and Global SMID Company Growth portfolios as of September 30, 2023.
4Source: Bloomberg as of September 30, 2023.
This information is provided for illustrative purposes only. Opinions and views expressed constitute the judgment of Polen Capital as of December 2023 and may involve a number of assumptions and estimates which are not guaranteed and are subject to change without notice or update. Although the information and any opinions or views given have been obtained from or based on sources believed to be reliable, no warranty or representation is made as to their correctness, completeness, or accuracy. Opinions, estimates, forecasts, and statements of financial market trends that are based on current market conditions constitute our judgment and are subject to change without notice, including any forward-looking estimates or statements which are based on certain expectations and assumptions. The views and strategies described may not be suitable for all clients. This document does not identify all the risks (direct or indirect) or other considerations which might be material to you when entering any financial transaction.
This should not be construed as a recommendation to purchase, hold or sell any particular security. There is no assurance that any securities discussed herein will remain in the portfolio or that the securities sold will not be repurchased. The securities discussed do not represent the entire portfolio. Actual holdings will vary depending on the size of the account, cash flows, and restrictions. It should not be assumed that any of the securities, transactions or holdings discussed will prove to be profitable, or that the investment recommendations or decisions we make in the future will be profitable or will equal the investment performance of the securities discussed herein. A complete list of our past specific recommendations for the last year is available upon request.
The Russell 2000® Growth Index is a market capitalization weighted index that measures the performance of the small-cap growth segment of the U.S. equity universe. It includes Russell 2000® Index companies with higher price/book ratios and higher forecasted growth values. The index is maintained by the FTSE Russell, a subsidiary of the London Stock Exchange Group.
The volatility and other material characteristics of the indices referenced may be materially different from the performance achieved by an individual investor. In addition, an investor’s holdings may be materially different from those within the index. Indices are unmanaged and one cannot invest directly in an index.
Past performance does not guarantee future results and profitable results cannot be guaranteed.